
Why We Looked Into This? »👀
|
Internally Generated Revenue by Nigerian States from 2007 to 2020
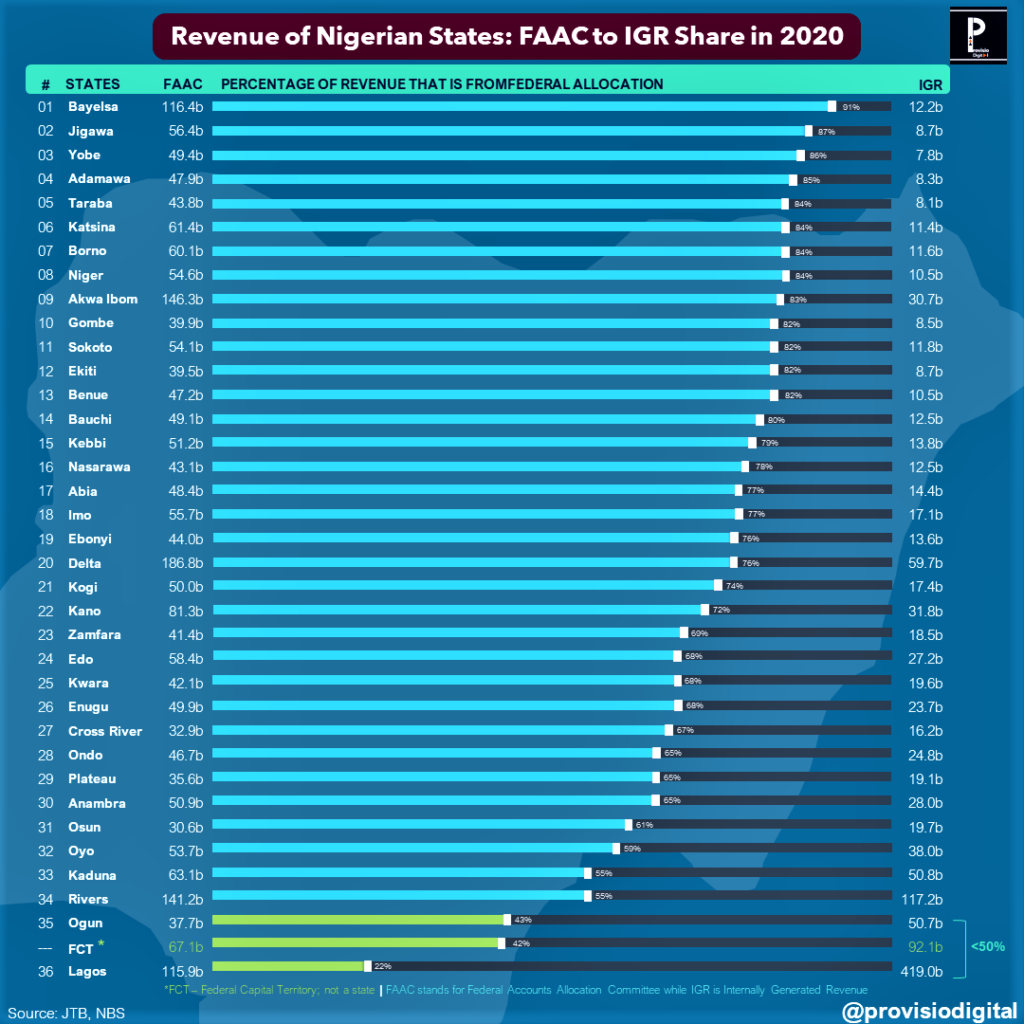
- From 2007 to 2020, Lagos’ IGR surpassed all other states even when there was a reduction in growth rate.
- In 2010 and 2015, the yoy (year-on-year) growth rate of Lagos’ IGR reduced.
- Most Nigerian States generate less than 50bn Naira revenue annually; only 6 States generated above this amount in 2020. In 2016, Ogun joined the ’50bn league”.
- In relative comparison, Lagos’ IGR in 2020 is ~2.3x bigger than that of all North Central States combined; ~7.4x bigger than that of all North Eastern States combined; ~2.4x bigger than that of all North Western States combined; ~4.3x bigger than that of all South Eastern States combined; ~1.6x bigger than that of all North Eastern States combined; ~3x bigger than that of all South Western States combined. For its immediate neighbor, Ogun State, Lagos’ IGR is ~8.3x bigger.
- The 2016 recession did not reduce IGR for states but there was a general reduction in 2015. From 2014 – 2015, there was a negative growth in States’ IGR
- In 2020, another year of recession in Nigeria, there was a negative growth in States’ IGR.
Note: FCT data not available until 2018. Ebonyi data not available in 2015.
Debt to Revenue Share of States in 2020
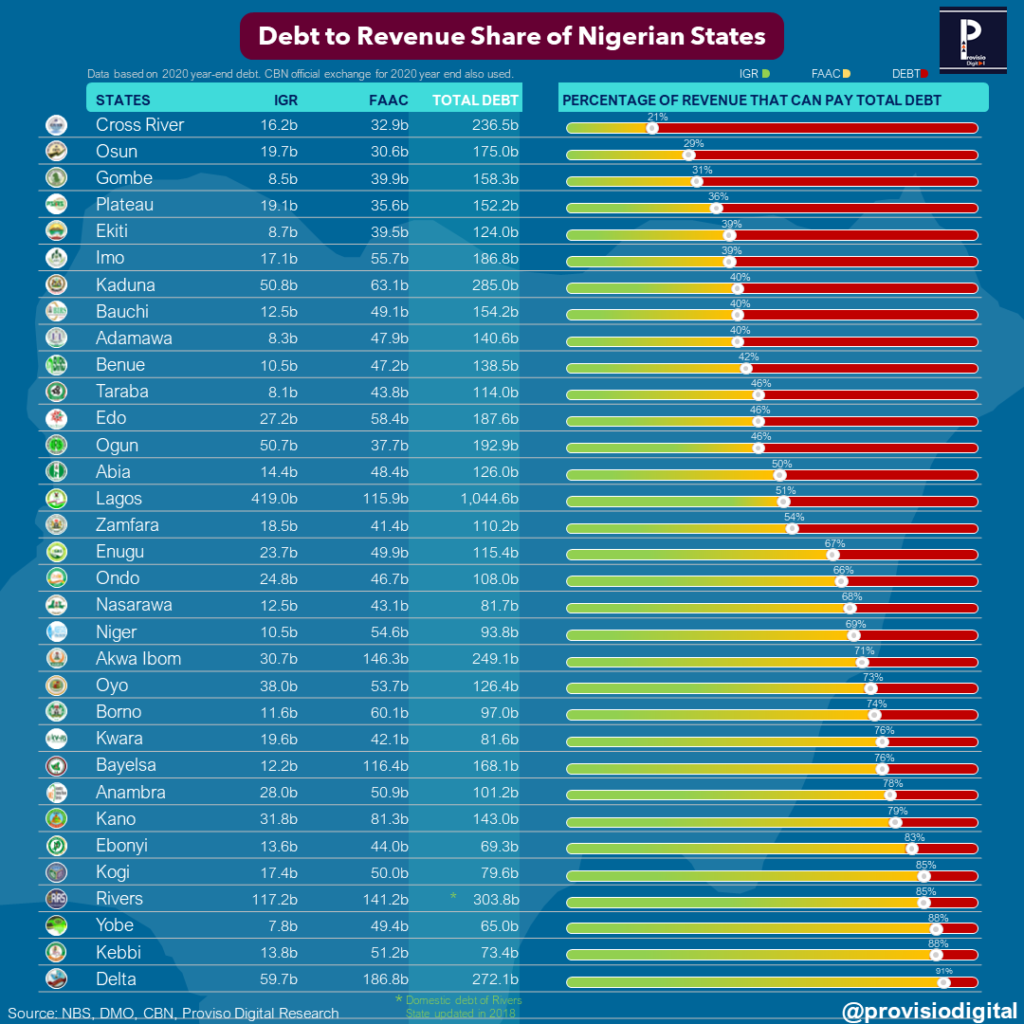
- A debt-to-revenue (DTR) ratio measures how much of a State’s income can be used to pay its debt. For every 1 Naira earned by a state, how much is used to pay its debt?
- In 2020, only 3 states had a DTR of <1:1. These were Katsina, Sokoto and Jigawa.
- Cross River State had the highest DTR of 4.8:1. As shown on the image, only 26% of its revenue can pay its debt.
- 20 states have 50% of theirt revenue matching total debt.
- Lagos, Rivers, Kaduna, Delta, Akwa Ibom and Cross River states have the highest debt amounts respectively (above 200bn Naira). Lagos has the highest debt of 1.044 trillion naira. This is 18% of total debts owed by all States (except FCT).
- In relative comparison, Lagos’ debt is nearly the amount of the total debt owed by the next 4 States after it in the top 5 league.
- Lagos’ debt is nearly the amount of the total debt owed by the least indebted states – 13 States combined (except the FCT).
- While Lagos has the highest debt profile, 51% of its revenue can match its debt.
- If only the States’ IGR were used to meet debt obligations, Lagos and Rivers are at 40% and 39% levels. This is followed by Oyo, Anambra and Ogun at 30%, 28% and 26% respectively. These states can pay part of their debt at these percentage levels.
- If only the States’ IGR were used to meet debt obligations, Gombe and Adamawa are at the bottom at 5% and 6% respectively.
- Most states (17 of them) can meet their debt obligations (>50%) using Federal Allocations (FAAC). Jigawa, Sokoto and Katsina come out tops at 132%, 96% and 88% respectively. This means that federal allocations help to shore up total revenue of states.
⚠️Note: This analysis was performed using States’ debt profile for 2020. Thus, while theoretical (for instance, exchange rate of USD to Naira affects current realities). Data for Rivers state domestic debt was last updated in 2018 and this does not provide a true reflection of the figures. Katsina State’s domestic debt was last updated in September 2020.
Politics, Governance and Economy: IGR of States 2007 to 2011
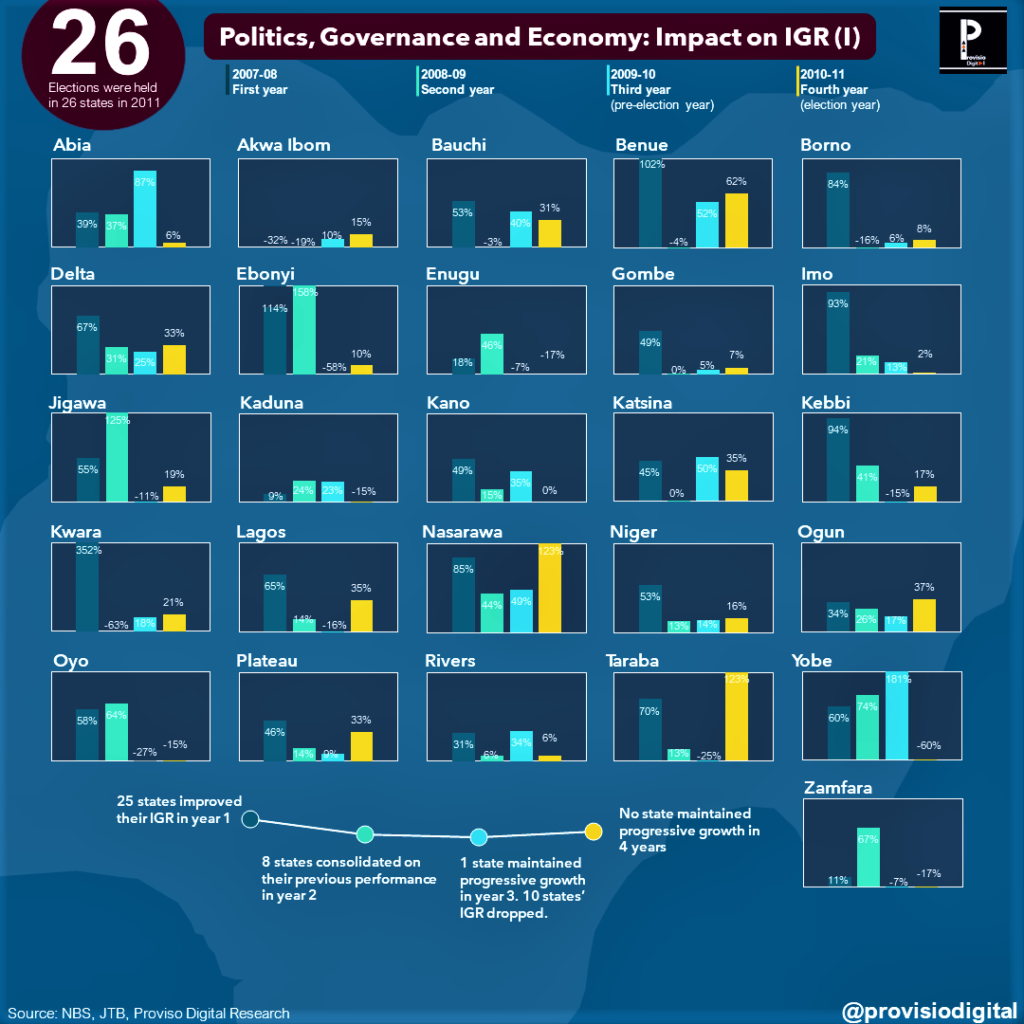
- In Nigeria, election cycles run every 4 years. State governors can run for two 4-year terms. In 2011, elections were held in 26 states due to tenure completion of the remaining 10 states being different.
- Political analysts often cite the first year in office for elected officers as the year of settling down in office; the second year for implementation of policies; the third year for consolidation and/or election preparation and the fourth year as election year. The 4th year could be handover or continuation of an administration.
- Does politics and governance play a role in states’ ability to generate IGR? Are political office holders able to maintain a progressive increase in revenue?
- From 2007 to 2011, no state maintained a progressive increase ⬆️ in its IGR (internally generated revenue).
- Yobe state managed to grow its revenue for 3 years until the 4th year when IGR dropped.
- In the first year, Kwara State had a massive increase in IGR with a 352% growth. Akwa Ibom had the lowest with a -32% decrease in IGR.
- In the second year, Jigawa State doubled its IGR while Enugu and Zamfara States’ IGR increased by ~2.5x and ~6x respectively. Ebonyi, Oyo and Yobe also recorded considerable growth in IGR.
- In the third year leading up to elections, Yobe State stood out by doubling its IGR. 12 other states were also able to increase IGR from the previous year.
- In the fourth year, Taraba State recorded a significant increase from a previous -25% decrease to 123%. The fourth year is peculiar because there could be a change in power depending on the election results of the respective states. Nonetheless, 15 states recorded a positive growth in IGR in 2011.
- In conclusion, there was no consistent pattern of growth in yearly revenue.
⚠️Note: this trend is only a year-on-year percentage change analysis based on the amounts generated by each state. Population size and tax net are important variables to consider.
Politics, Governance and Economy: IGR of States 2011 to 2015
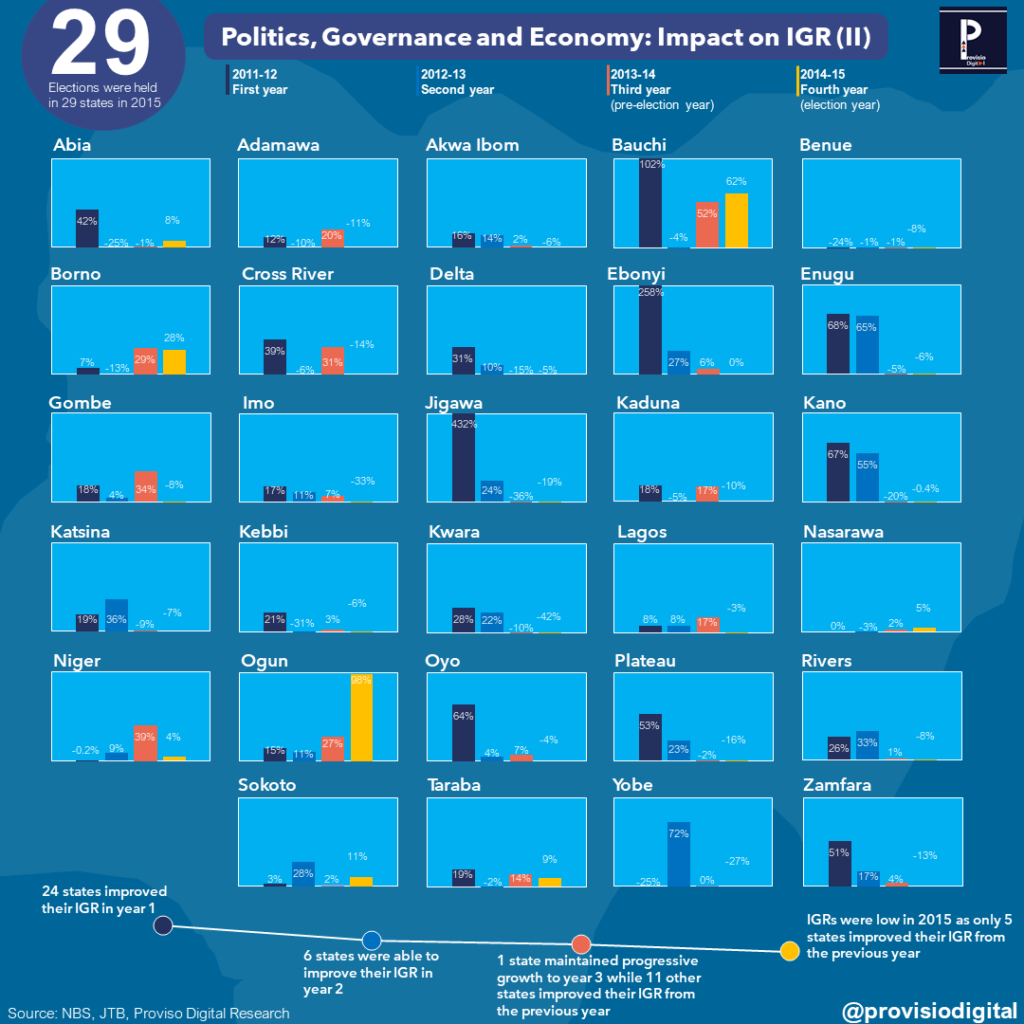
- In 2015, elections were held in 29 states due to tenure completion of the remaining 10 states being different.
- IGR yearly growth was generally low during this period.
- There was no consistent increasing yearly revenue.
⚠️Note: this trend is only a year-on-year percentage change analysis based on the amounts generated by each state. Population size and tax net are important variables to consider.
Politics, Governance and Economy: IGR of States 2015 to 2019
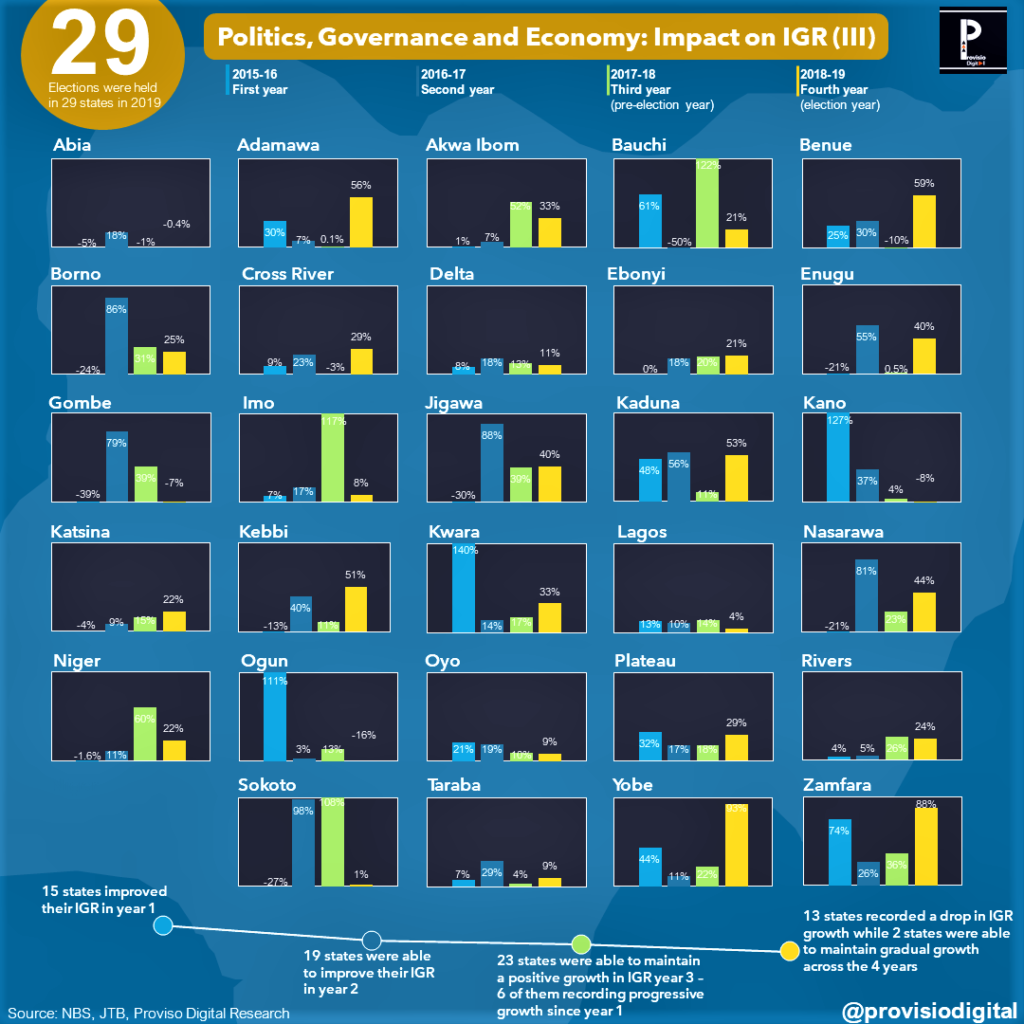
- In 2019, elections were held in 29 states due to tenure completion of the remaining 10 states being different.
- 2015 to 2019 trend was relatively better than the previous term
- Only one state (Katsina) was able to record progressive increase for 3 years.
- In conclusion, there was no consistent pattern of growth in yearly revenue.
⚠️Note: this trend is only a year-on-year percentage change analysis based on the amounts generated by each state. Population size and tax net are important variables to consider.